In this example, I used Ubuntu 22.04 LTS to demonstrate how to diagnose the network interfaces in Ubuntu.
Chapter 1: Troubleshooting Network Connection
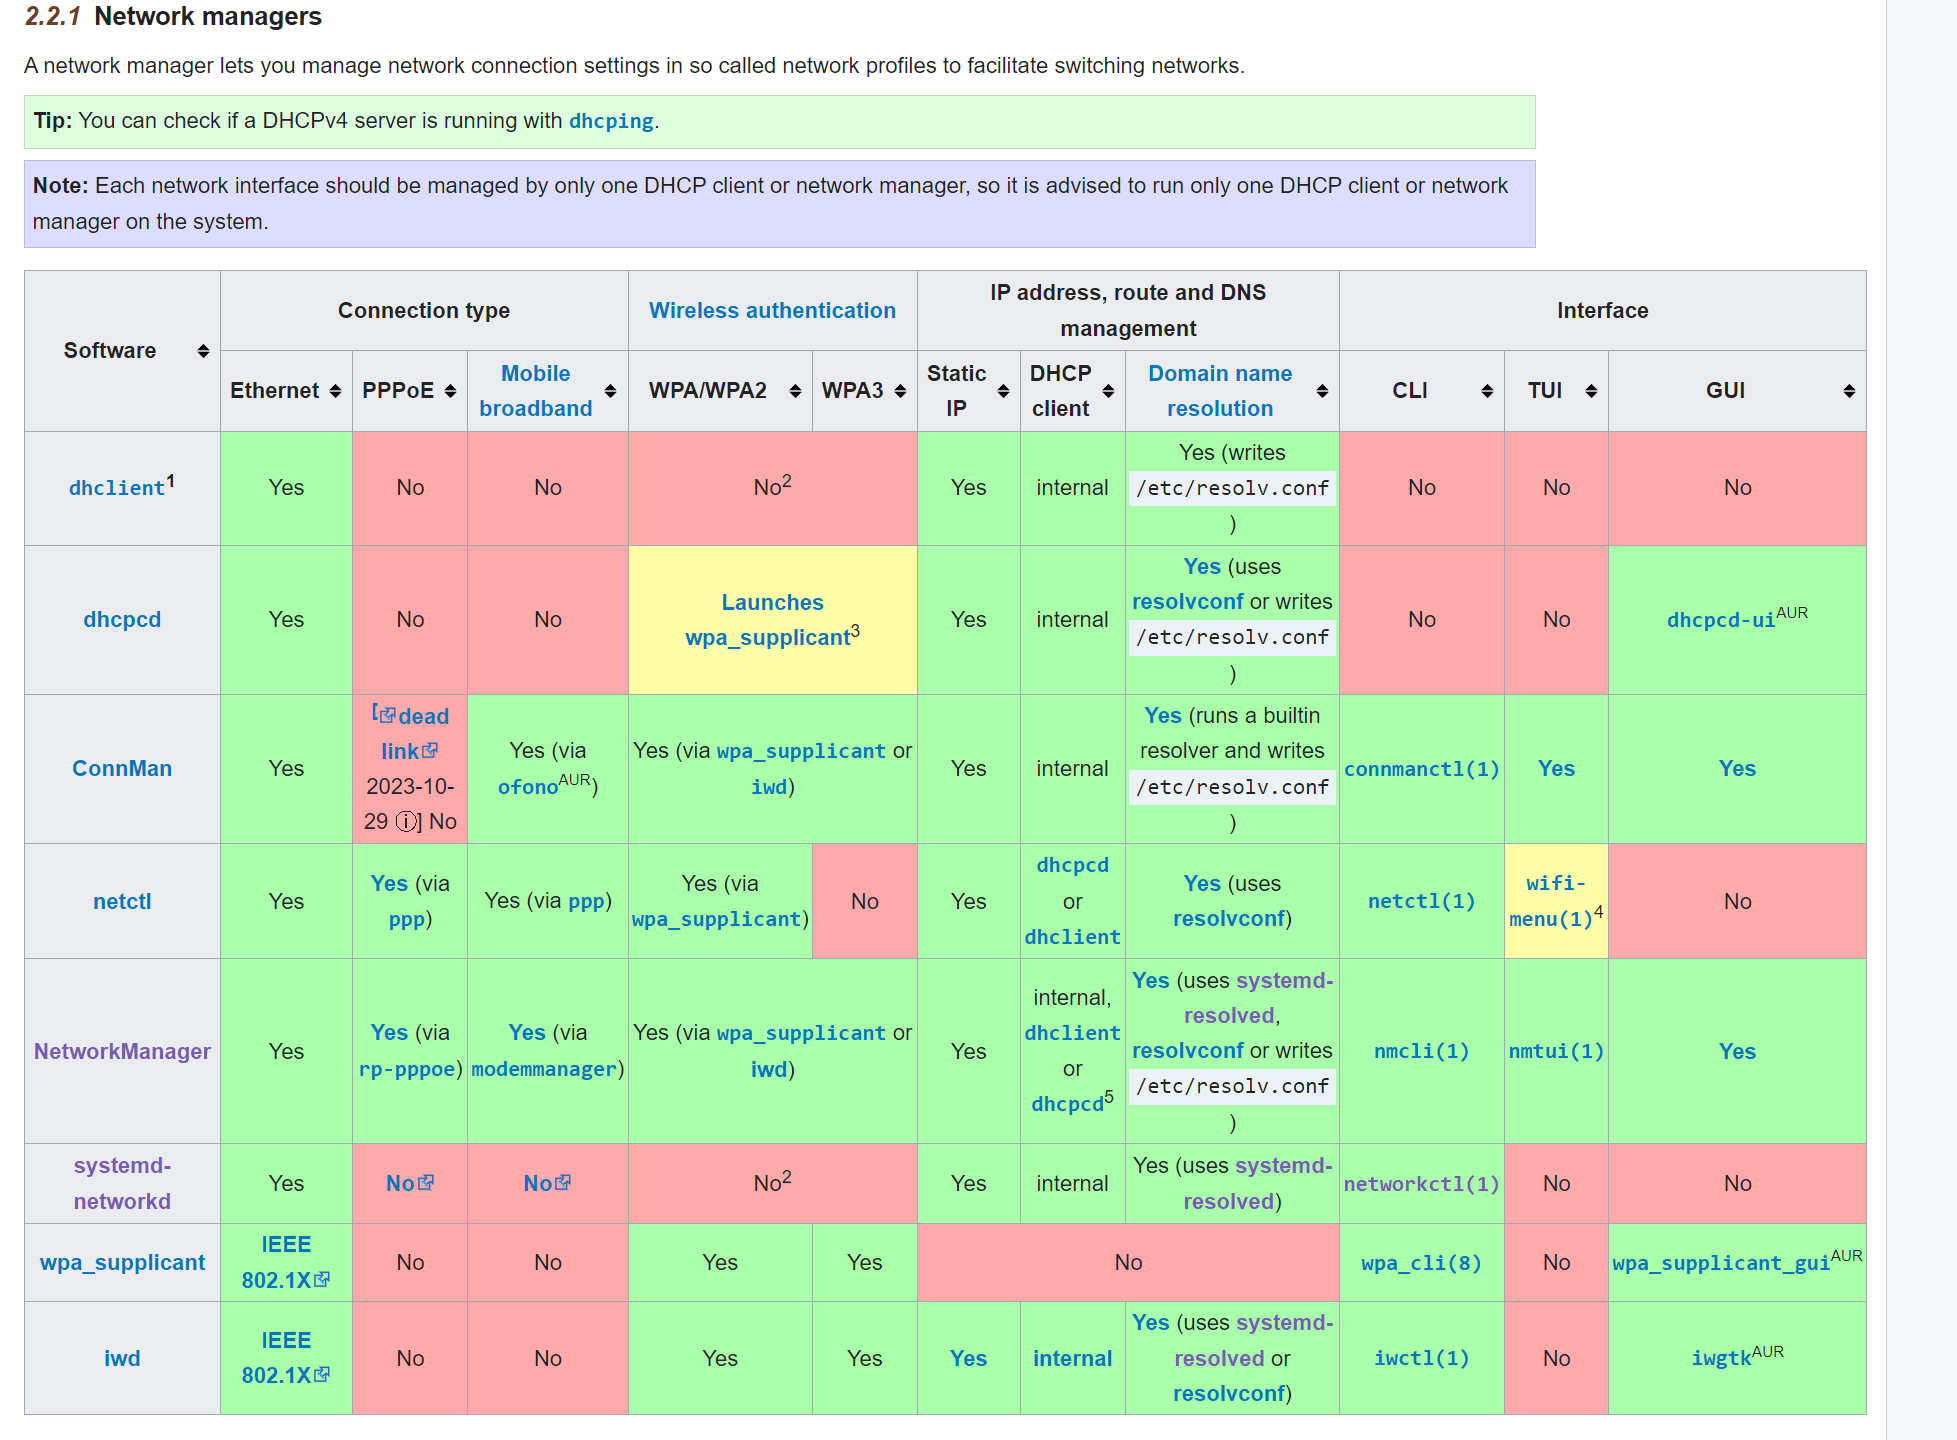
Ubuntu 22.04 switched to systemd-networkd as the default network manager. systemd-networkd is a system service that manages networks. It detects and configures network devices as they appear, as well as creating virtual network devices.
For older versions, Ubuntu may use NetworkManager as the default network manager, which is not covered in this example. You can read Arch Linux's Network Manager for more information.
For other Linux distributions, the network manager may be different. You can read Arch Linux's Network configuration for more information.
Step 1 - Check physical network interfaces
Of course you need to make sure the physical network interfaces are connected to the system.
To check, run the following command:
sudo lspci
sudo lsusb
Your network interface should be listed in the output.
anduin@iot:~$ sudo lspci
02:02.0 Ethernet controller: VMware VMXNET3 Ethernet Controller (rev 01)
02:05.0 Ethernet controller: Intel Corporation 82599ES 10-Gigabit SFI/SFP+ Network Connection (rev 01)
02:05.1 Ethernet controller: Intel Corporation 82599ES 10-Gigabit SFI/SFP+ Network Connection (rev 01)
Step 2 - Know the name of the network interfaces
To know the name of the network interfaces, run the following command:
sudo ip link show
Your network interface should be listed in the output.
anduin@iot:~$ sudo ip link show
1: lo: <LOOPBACK,UP,LOWER_UP> mtu 65536 qdisc noqueue state UNKNOWN mode DEFAULT group default qlen 1000
    link/loopback 00:00:00:00:00:00 brd 00:00:00:00:00:00
2: ens34: <BROADCAST,MULTICAST,UP,LOWER_UP> mtu 1500 qdisc mq state UP mode DEFAULT group default qlen 1000
    link/ether 00:0c:29:27:38:8e brd ff:ff:ff:ff:ff:ff
    altname enp2s2
3: ens37f0: <NO-CARRIER,BROADCAST,MULTICAST,UP> mtu 1500 qdisc mq state DOWN mode DEFAULT group default qlen 1000
    link/ether d4:20:00:b1:d7:bf brd ff:ff:ff:ff:ff:ff
    altname enp2s5f0
4: ens37f1: <BROADCAST,MULTICAST,UP,LOWER_UP> mtu 1500 qdisc mq state UP mode DEFAULT group default qlen 1000
    link/ether d4:20:00:b1:d7:c0 brd ff:ff:ff:ff:ff:ff
    altname enp2s5f1
Right now, I have two network interfaces: ens34, ens37f0, and ens37f1.
Step 3 - Check Netplan configuration
Netplan is the new way to configure networking in Ubuntu 18.04 and later. It is a YAML network configuration abstraction for various backends.
First, go to the /etc/netplan directory and check the configuration file. There should be a file called 00-installer-config.yaml or 01-netcfg.yaml or 50-cloud-init.yaml or something similar.
You can delete all unnecessary files and keep only one file. You can keep the 01-netcfg.yaml file and delete the rest.
sudo mv /etc/netplan/* /tmp
sudo touch /etc/netplan/01-netcfg.yaml
Now, edit the 01-netcfg.yaml file and make sure it looks like this:
network:
  renderer: networkd
  ethernets:
    ens34:
      addresses:
       - 10.64.50.111/12
      dhcp4: false
      routes:
        - to: default
          via: 10.64.0.1
      nameservers:
        addresses: [10.64.0.1]
    ens37f0:
      dhcp4: true
  version: 2
In the example above, ens34 is configured with a static IP address and ens37f0 is configured with DHCP.
For some laptops, you may have a wireless interface. In that case, you can add the wireless interface to the configuration file.
network:
  renderer: networkd
  ethernets:
    ens37f0:
      dhcp4: true
    wifis:
        wlp3s0:
            optional: true
            access-points:
                "SSID-NAME-HERE":
                    password: "PASSWORD-HERE"
            dhcp4: true
In the example above, wlp3s0 is the wireless interface. You can replace SSID-NAME-HERE with the SSID of your wireless network and PASSWORD-HERE with the password of your wireless network.
Step 4 - Apply the configuration
After editing the file, apply the configuration:
sudo chown root:root /etc/netplan/01-netcfg.yaml
sudo chmod 600 /etc/netplan/01-netcfg.yaml
sudo netplan apply
Since we are using systemd-networkd, netplan will generate the configuration files in the /run/systemd/network directory.
anduin@iot:~$ ls /run/systemd/network
10-netplan-ens34.network  10-netplan-ens37f0.network  10-netplan-ens37f1.network

anduin@iot:~$ cat /run/systemd/network/10-netplan-ens34.network
[Match]
Name=ens34

[Network]
LinkLocalAddressing=ipv6
Address=10.64.50.111/12
DNS=10.64.0.1

[Route]
Destination=0.0.0.0/0
Gateway=10.64.0.1

anduin@iot:~$ cat /run/systemd/network/10-netplan-ens37f0.network
[Match]
Name=ens37f0

[Network]
DHCP=ipv4
LinkLocalAddressing=ipv6

[DHCP]
RouteMetric=100
UseMTU=true
Step 5 - Check the status of the network interfaces
To check the status of the network interfaces, run the following command:
sudo ethtool <interface>
For example:
anduin@iot:~$ sudo ethtool ens34
Settings for ens34:
        Supported ports: [ TP ]
        Supported link modes:   1000baseT/Full
                                10000baseT/Full
        Supported pause frame use: No
        Supports auto-negotiation: No
        Supported FEC modes: Not reported
        Advertised link modes:  Not reported
        Advertised pause frame use: No
        Advertised auto-negotiation: No
        Advertised FEC modes: Not reported
        Speed: 10000Mb/s
        Duplex: Full
        Auto-negotiation: off
        Port: Twisted Pair
        PHYAD: 0
        Transceiver: internal
        MDI-X: Unknown
        Supports Wake-on: uag
        Wake-on: d
        Link detected: yes
That command will help you to check the speed, duplex, and link status of the network interfaces. It also outputs if the link is detected or not.
Make sure the link is detected and the speed and duplex are correct.
Step 6 - Check Systemd-networkd status
To check the status of systemd-networkd, run the following command:
sudo systemctl status systemd-networkd
You should see the status of systemd-networkd as active (running).
You can check the status of the network interfaces using the networkctl command.
anduin@iot:~$ sudo networkctl list
IDX LINK    TYPE     OPERATIONAL SETUP
  1 lo      loopback carrier     unmanaged
  2 ens34   ether    routable    configured
  3 ens37f0 ether    no-carrier  configuring
  4 ens37f1 ether    routable    configured

4 links listed.
Then, check the status of the network interfaces:
sudo networkctl status <interface>
For example:
anduin@iot:~$ sudo networkctl status ens34
● 2: ens34
                     Link File: /usr/lib/systemd/network/99-default.link
                  Network File: /run/systemd/network/10-netplan-ens34.network
                          Type: ether
                         State: routable (configured)
                  Online state: online
             Alternative Names: enp2s2
                          Path: pci-0000:02:02.0
                        Driver: vmxnet3
                        Vendor: VMware
                         Model: VMXNET3 Ethernet Controller
                    HW Address: 00:0c:29:27:38:8e (VMware, Inc.)
                           MTU: 1500 (min: 60, max: 9190)
                         QDisc: mq
  IPv6 Address Generation Mode: eui64
          Queue Length (Tx/Rx): 4/4
              Auto negotiation: no
                         Speed: 10Gbps
                        Duplex: full
                          Port: tp
                       Address: 10.24.86.43 (DHCP4 via 10.0.0.1)
                                fe80::20c:29ff:fe27:388e
                       Gateway: 10.0.0.1
                           DNS: 10.0.0.1
                Search Domains: green
             Activation Policy: up
           Required For Online: yes
               DHCP4 Client ID: IAID:0x7294586/DUID
             DHCP6 Client DUID: DUID-EN/Vendor:0000ab11382c8e978ef1e1310000
Sometimes, for DHCP interfaces, you need to refresh the interface to get the IP address. You can do this by running the following command:
sudo networkctl forcerenew <interface>
Networkctl also support other operations, like:
- delete: Delete the specified interface.
- forceflush: Force flush the DHCP lease for the specified interface.
- list: List all interfaces.
- reconfigure: Reconfigure the specified interface.
- renew: Renew the DHCP lease for the specified interface.
- up: Bring the specified interface up.
- down: Bring the specified interface down.
- label: Set the label of the specified interface.
- lldp: Show the LLDP information for the specified interface.
- reload: Reload the configuration of the specified interface.
- status: Show the status of the specified interface.
Step 6.1 - Run ifconfig
For some people, ifconfig is still the most familiar command to check the network interfaces.
sudo apt install net-tools
ifconfig
The output should show the IP address, netmask, and broadcast address of the network interfaces.
anduin@iot:~$ ifconfig
ens34: flags=4163<UP,BROADCAST,RUNNING,MULTICAST>  mtu 1500
        inet 10.24.86.43  netmask 255.192.0.0  broadcast 10.63.255.255
        inet6 fe80::20c:29ff:fe27:388e  prefixlen 64  scopeid 0x20<link>
        ether 00:0c:29:27:38:8e  txqueuelen 1000  (Ethernet)
        RX packets 21436  bytes 1330874 (1.3 MB)
        RX errors 0  dropped 0  overruns 0  frame 0
        TX packets 1228  bytes 122770 (122.7 KB)
        TX errors 0  dropped 0 overruns 0  carrier 0  collisions 0

ens37f0: flags=4099<UP,BROADCAST,MULTICAST>  mtu 1500
        inet6 fe80::d620:ff:feb1:d7bf  prefixlen 64  scopeid 0x20<link>
        ether d4:20:00:b1:d7:bf  txqueuelen 1000  (Ethernet)
        RX packets 73  bytes 4440 (4.4 KB)
        RX errors 0  dropped 0  overruns 0  frame 0
        TX packets 8  bytes 628 (628.0 B)
        TX errors 0  dropped 0 overruns 0  carrier 0  collisions 0

lo: flags=73<UP,LOOPBACK,RUNNING>  mtu 65536
        inet 127.0.0.1  netmask 255.0.0.0
        inet6 ::1  prefixlen 128  scopeid 0x10<host>
        loop  txqueuelen 1000  (Local Loopback)
        RX packets 53  bytes 5040 (5.0 KB)
        RX errors 0  dropped 0  overruns 0  frame 0
        TX packets 53  bytes 5040 (5.0 KB)
        TX errors 0  dropped 0 overruns 0  carrier 0  collisions 0
Alternatively, you can use the ip command to check the network interfaces.
ip link show
ip lists the network interfaces and their status, and it does not require installing the net-tools package.
anduin@lab:~$ ip link show
1: lo: <LOOPBACK,UP,LOWER_UP> mtu 65536 qdisc noqueue state UNKNOWN mode DEFAULT group default qlen 1000
    link/loopback 00:00:00:00:00:00 brd 00:00:00:00:00:00
2: ens160: <BROADCAST,MULTICAST,UP,LOWER_UP> mtu 1500 qdisc mq state UP mode DEFAULT group default qlen 1000
    link/ether 00:50:56:94:04:42 brd ff:ff:ff:ff:ff:ff
    altname enp3s0
3: ens192: <BROADCAST,MULTICAST,UP,LOWER_UP> mtu 1500 qdisc mq state UP mode DEFAULT group default qlen 1000
    link/ether 00:50:56:94:dc:25 brd ff:ff:ff:ff:ff:ff
    altname enp11s0
4: docker0: <NO-CARRIER,BROADCAST,MULTICAST,UP> mtu 1500 qdisc noqueue state DOWN mode DEFAULT group default
    link/ether 02:42:d3:4c:38:f7 brd ff:ff:ff:ff:ff:ff
Step 7 - Check the routing table
To check the routing table, run the following command:
sudo ip route
You should see the routing table with the correct default gateway.
default via 10.64.0.1 dev ens192 proto static
default via 10.0.0.1 dev ens160 proto dhcp src 10.55.229.3 metric 100
10.0.0.0/10 dev ens160 proto kernel scope link src 10.55.229.3 metric 100
10.0.0.1 dev ens160 proto dhcp scope link src 10.55.229.3 metric 100
10.64.0.0/12 dev ens192 proto kernel scope link src 10.64.50.149
To check the routing table for a specific interface, run the following command:
traceroute <destination>
Step 8 - Check the DNS resolution
First you need to know which is the DNS server. You can check the DNS server by running the following command:
cat /etc/resolv.conf
To check the DNS resolution, run the following command:
resolvectl status
Above command will show you the DNS server and the DNS domain.
anduin@lab:~$ resolvectl status
Global
       Protocols: -LLMNR -mDNS -DNSOverTLS DNSSEC=no/unsupported
resolv.conf mode: stub

Link 2 (ens160)
    Current Scopes: DNS
         Protocols: +DefaultRoute +LLMNR -mDNS -DNSOverTLS DNSSEC=no/unsupported
Current DNS Server: 10.0.0.1
       DNS Servers: 10.0.0.1
        DNS Domain: green

Link 3 (ens192)
    Current Scopes: DNS
         Protocols: +DefaultRoute +LLMNR -mDNS -DNSOverTLS DNSSEC=no/unsupported
Current DNS Server: 10.64.0.1
       DNS Servers: 10.64.0.1

Link 4 (docker0)
Current Scopes: none
     Protocols: -DefaultRoute +LLMNR -mDNS -DNSOverTLS DNSSEC=no/unsupported
Of course, you can also check the DNS resolution by running the nslookup command or the dig command.
For example, I want to ask my router 10.0.0.1 to resolve the IP address of www.google.com:
anduin@lab:~$ nslookup www.google.com 10.0.0.1
Server:         10.0.0.1
Address:        10.0.0.1#53

Name:   www.google.com
Address: 172.217.175.68
Step 9 - Check the HTTP connection
To check the HTTP connection, run the following command:
curl -I http://www.google.com/generate_204
You should see the HTTP response from the server.
anduin@iot:~$ curl -I http://www.google.com/generate_204
HTTP/1.1 204 No Content
Content-Length: 0
Cross-Origin-Resource-Policy: cross-origin
Date: Thu, 29 Feb 2024 16:57:38 GMT
Then, you are already connected to the internet.
That's it! You have successfully diagnosed the network interfaces in Ubuntu. Now you are cleared to browse the internet.
Chapter 2: Troubleshooting Network traffic
In some cases, you may have some unknown network traffic that consumes your network bandwidth. You can use the following tools to diagnose the network traffic.
Before starting, you need to confirm which interface is to be monitored. You can use the ip link show command to list the network interfaces.
sudo ip link show
Steps to mitigate network traffic issues:
- Confirm the interface to be monitored.
- Use
dstatto keep monitoring the overall network traffic. - Use
iftopto monitor the network traffic on a specific interface. - Use
nloadto visualize the network traffic on a specific interface. - Use
nethogsto briefly inspect the network traffic by process. - Use
tcpdumpto capture and inspect the network packets. - Confirm the port usage.
- Confirm the process ID and location.
- Block the network traffic by IP address.
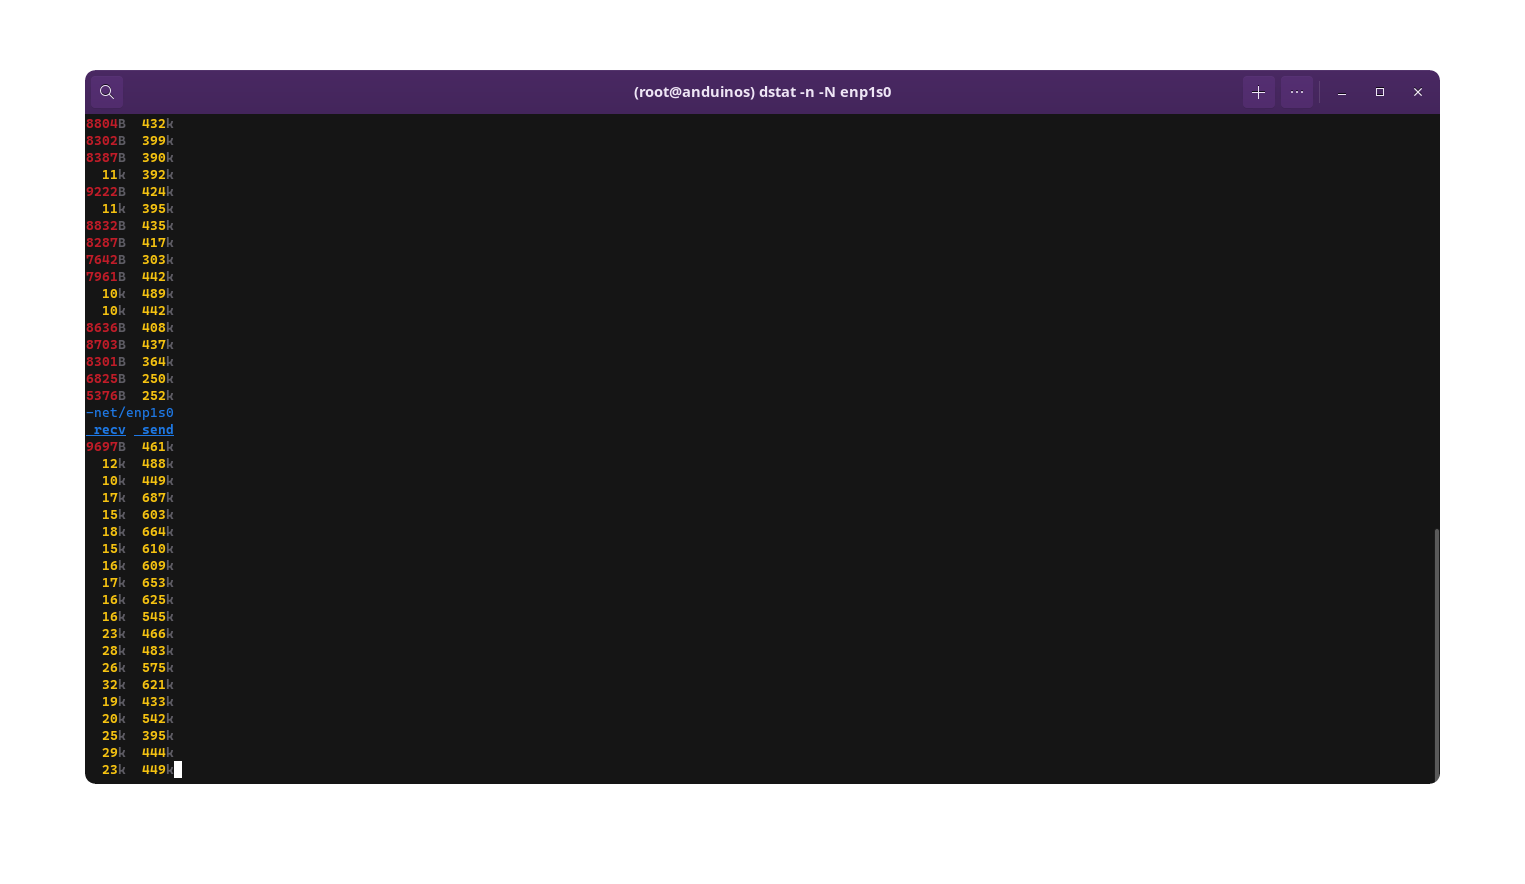
Step 1.1 - Use dstat to keep monitoring the overall network traffic
dstat is a command-line tool that displays system statistics. It shows a real-time view of the network traffic. It's recommended to use in a lot of cases. However, dstat by default shows the network traffic for all interfaces, including the virtual interfaces like docker0 and veth*.
If you plan on using dstat, you can use the following command to monitor the network traffic on a specific interface (For example, ens192):
sudo dstat -n -N ens192
Step 1.2 - Use iftop to monitor the network traffic on a specific interface
iftop is a command-line tool that displays bandwidth usage on an interface by host. It shows a real-time view of the network traffic.
To install iftop, run the following command:
sudo apt install iftop
To run iftop to keep monitoring the network traffic on a specific interface (For example, ens192), run the following command:
sudo iftop -i ens192 -n
-n argument shows raw IP instead of DNS name.
Output may be like this:
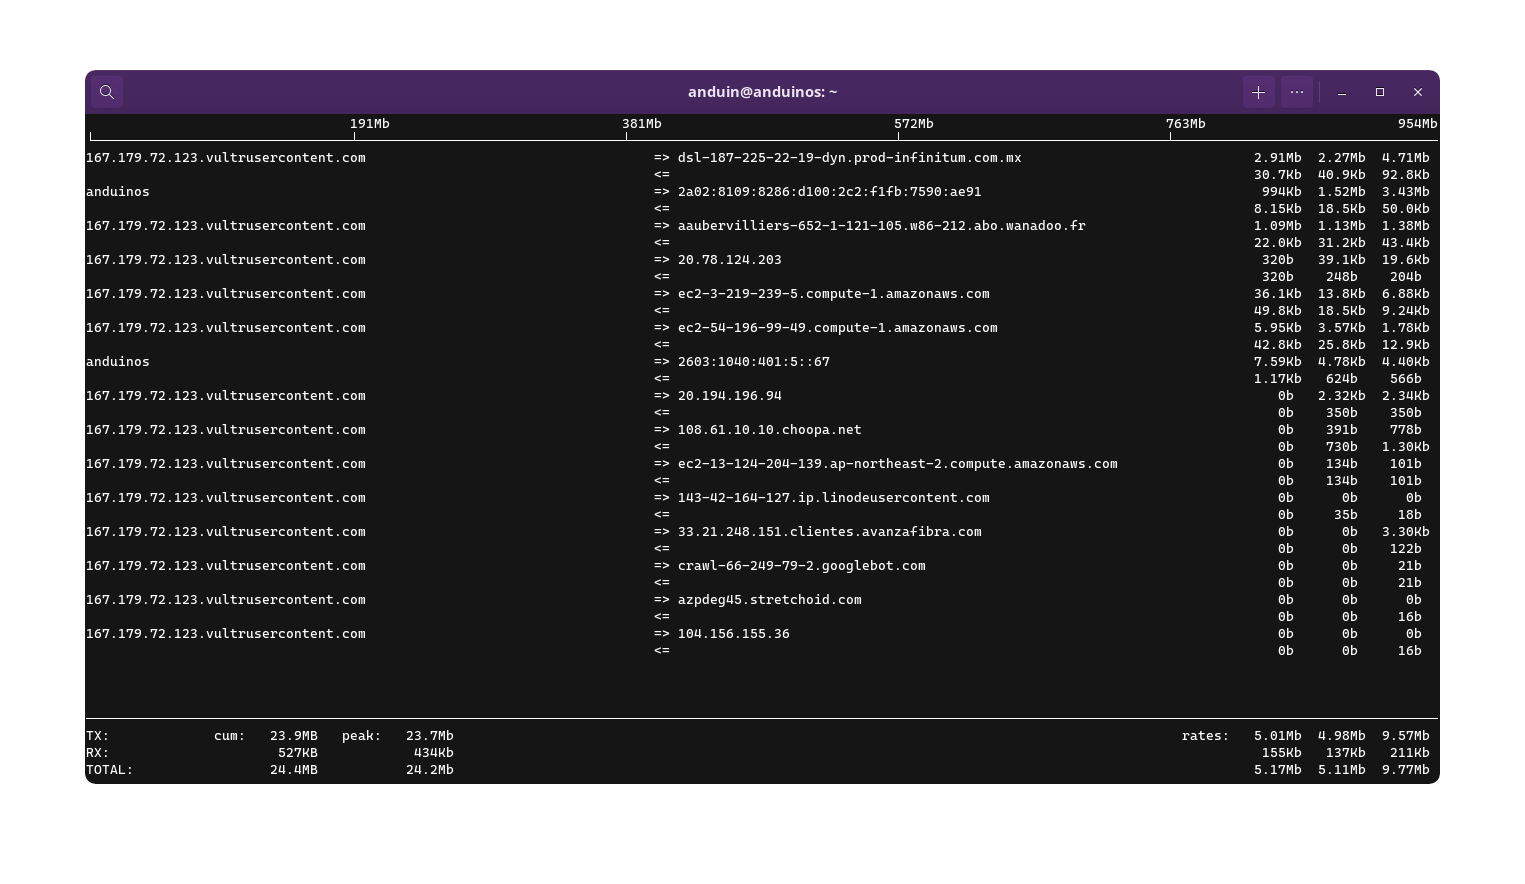
As you can see, iftop only displays the overall network traffic. It does not show the network traffic by process. If you want to see the network traffic by process, you can use nethogs.
Step 1.3 - Use nload to visualize the network traffic on a specific interface
nload is a command-line tool that displays the network traffic in a graph.
To install nload, run the following command:
sudo apt install nload
To run nload to keep monitoring the network traffic on a specific interface (For example, ens192), run the following command:
sudo nload ens192
Output may be like this:
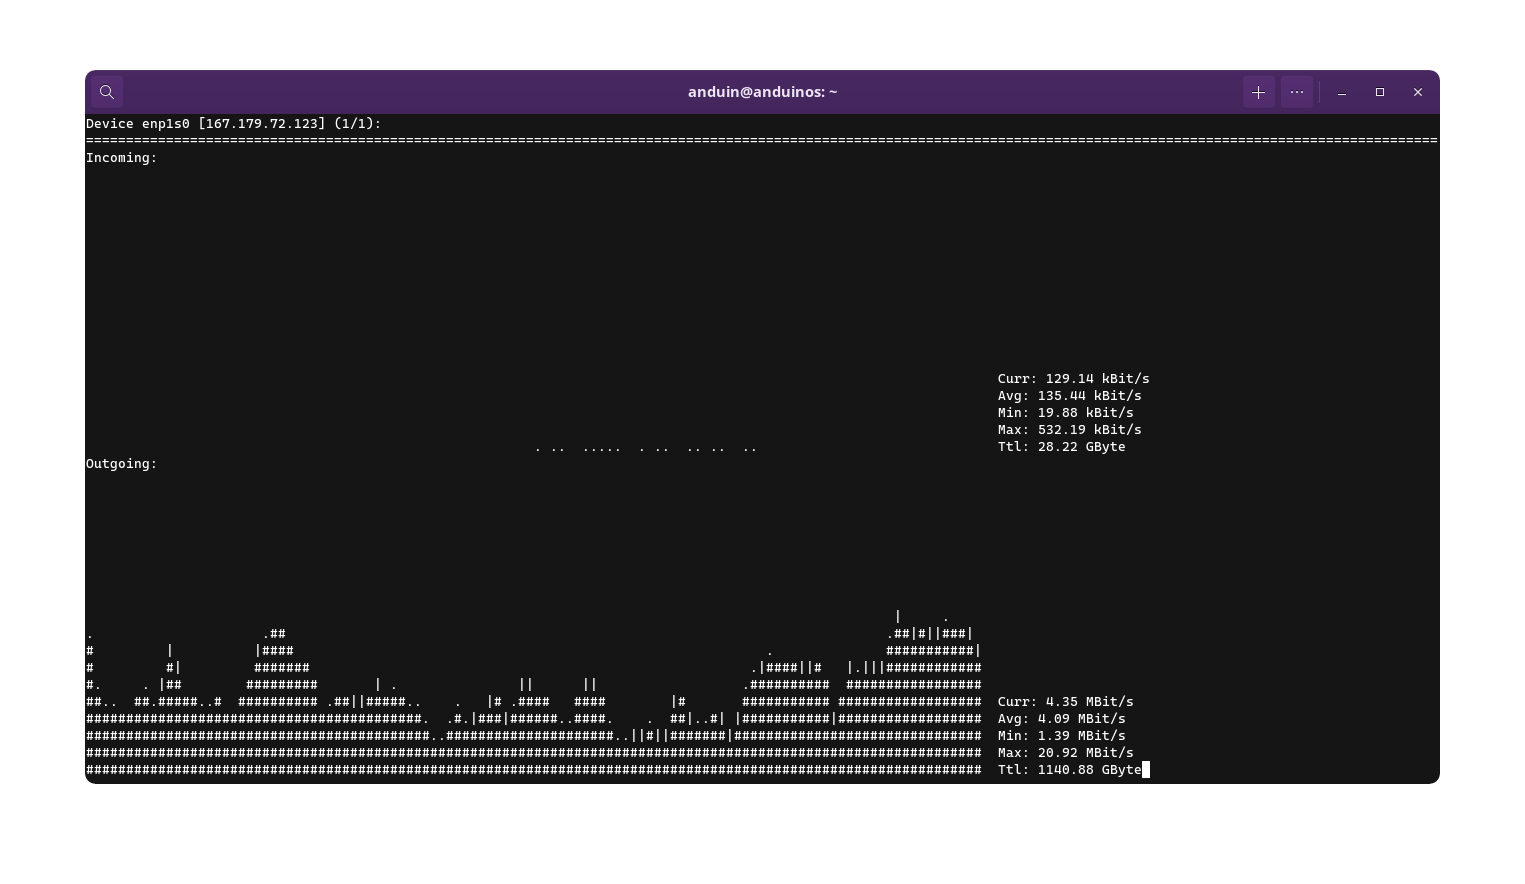
As you can see above, nload only display the overall network traffic. It does not show the network traffic by process. If you want to see the network traffic by process, you can use nethogs.
Step 2 - Use nethogs to inspect the network traffic by process
nethogs is a command-line tool that displays the network traffic by process.
To install nethogs, run the following command:
sudo apt install nethogs
To run nethogs to keep monitoring the network traffic on a specific interface (For example, ens192), run the following command:
sudo nethogs ens192
Output may be like this:
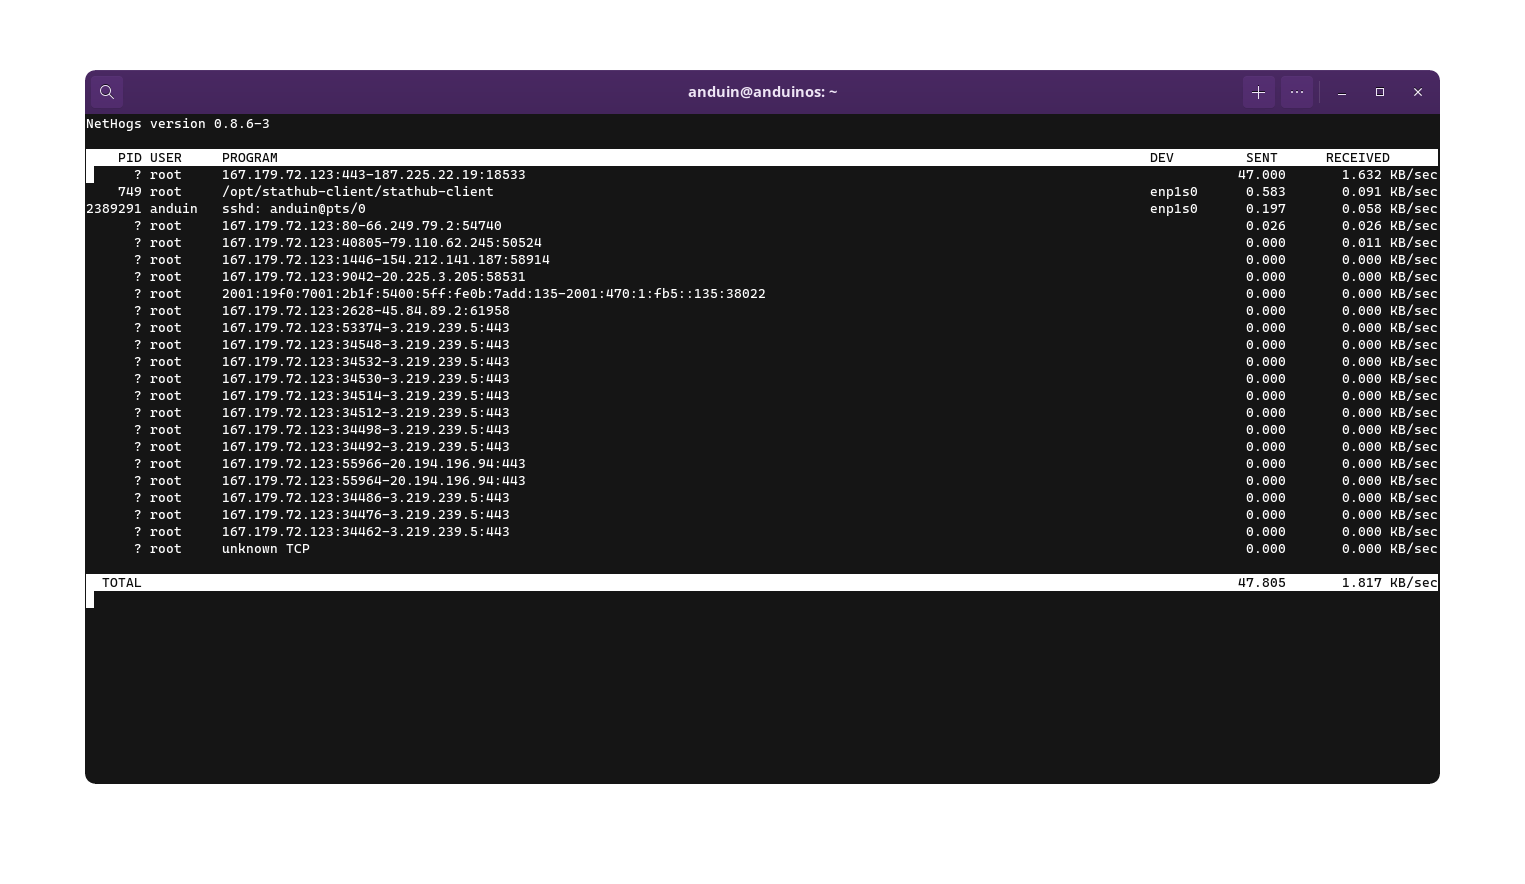
In the chart above, you can see the network traffic by process. However, some process ID may be shown as ?. This is because nethogs cannot determine the process ID. Those processes may be running in a Docker container or a virtual machine. You can also install nethogs on the Docker container or the virtual machine to monitor the network traffic.
So it's suggested to use tcpdump instead.
Step 3 - Use tcpdump to capture and inspect the network packets
tcpdump is a command-line tool that captures network packets. It shows a real-time view of the network traffic packets.
To install tcpdump, run the following command:
sudo apt install tcpdump
To run tcpdump to keep monitoring the network traffic on a specific interface (For example, ens192), run the following command:
sudo tcpdump -i ens192
Based on the output, you can see the network packets in real-time:
anduin@iot:~$ sudo tcpdump -i ens192
16:00:00.111111 IP6 2.3.4.5.https > 1.2.3.4: Flags [P.], seq 3878942:3881798, ack 48, win 42, options [nop,nop,TS val 2397183019 ecr 818874040], length 2856
16:00:00.111112 IP6 1.2.3.4 > 2.3.4.5.https: Flags [.], ack 3813858, win 4676, options [nop,nop,TS val 818874044 ecr 2397182732], length 0
On the example above, you can see two network packets.
- The first packet is from
2.3.4.5to1.2.3.4with the length of2856. - The second packet is from
1.2.3.4to2.3.4.5with the length of0. - Both packets are using the
httpsprotocol. (443 port. To output the port instead of the protocol, you can use the-noption.)
Step 4 - Confirm the port usage
To output which process is using the port, you can use the ss command.
For example, if you confirmed that the port 22 is consuming a lot of network traffic, you can use the following command to check the process ID:
ss -tuln | grep :22
Output may be like this:
anduin@anduinos:~$ sudo ss -tulnp | grep 22
Netid State         Recv-Q               Send-Q             Local Address:Port              Peer Address:Port      Process
tcp   LISTEN 0      128                  0.0.0.0:22         0.0.0.0:*                       users:(("sshd",pid=770,fd=3))
tcp   LISTEN 0      128                  [::]:22            [::]:*                       users:(("sshd",pid=770,fd=4))
As shown above, the port 22 is used by the process sshd with the process ID 770.
Step 5 - Confirm the process ID and location
You can use ps to check the process ID:
ps -ef | grep 770
As shown below, the process ID 770 is used by the sshd process, actually an executable file /usr/sbin/sshd.
anduin@anduinos:~$ ps -ef | grep 770
root         770       1  0 Sep08 ?        00:00:02 sshd: /usr/sbin/sshd -D [listener] 0 of 10-100 startups
root     2389068     770  0 16:10 ?        00:00:00 sshd: anduin [priv]
anduin   2392762 2389292  0 16:37 pts/0    00:00:00 grep --color=auto 770
Step 6 - Block the network traffic by IP address
If you want to block the network traffic by IP address, you can use the iptables command.
For example, to block the IP address 1.2.3.4 on the interface ens192 from incoming and outgoing traffic, run the following command:
sudo iptables -A INPUT -s 1.2.3.4 -i ens192 -j DROP
sudo iptables -A OUTPUT -d 1.2.3.4 -o ens192 -j DROP
To block an IPv6 address, for example, to block the IPv6 address 2001:db8::1 on the interface ens192 from incoming and outgoing traffic, run the following command:
sudo ip6tables -A INPUT -s 2001:db8::1 -i ens192 -j DROP
sudo ip6tables -A OUTPUT -d 2001:db8::1 -o ens192 -j DROP
However, usually we don't block a single IPv6 address because it's so easy for the attacker to change the IPv6 address. Instead, we block the entire IPv6 subnet.
To block the entire IPv6 subnet, for example, to block the IPv6 subnet 2001:db8::/32 on the interface ens192 from incoming and outgoing traffic, run the following command:
sudo ip6tables -A INPUT -s 2001:db8::/32 -i ens192 -j DROP
sudo ip6tables -A OUTPUT -d 2001:db8::/32 -o ens192 -j DROP
To check the iptables rules, run the following command:
sudo iptables -L
文章对Ubuntu网络诊断与监控的工具链进行了系统梳理,从基础诊断到高级监控的分层结构清晰,适合逐步排查场景。不过在实际应用中,某些工具的局限性值得进一步探讨。例如nethogs虽能按进程统计流量,但对容器环境的兼容性不足,建议补充对cgroup或eBPF技术的提及,以体现对现代云原生环境的适配。此外,tcpdump的过滤规则示例稍显基础,若能结合Wireshark的图形化解析流程,可能更利于复杂协议分析。关于防火墙部分,iptables虽仍被采用,但提到nftables作为新一代规则管理工具,或可引导读者关注其性能优势与语法简化特性。最后,针对IPv6的建议中提及的子网封锁策略,或许可以补充对RA抑制或NDP防护机制的讨论,以构建更立体的网络安全方案。
这篇文章详细介绍了如何监控和管理网络流量,从发现问题到采取措施阻止异常行为,整个流程清晰且具有操作性。作者通过逐步排查网络流量异常的原因,最终定位到具体的进程和服务,并采取了相应的iptables规则来阻止特定的IP地址或子网。这种系统化的排查思路对于管理员来说非常实用。
文章中提到的工具(如
ss、ps和iptables)都是Linux系统中常用的命令行工具,能够帮助用户快速定位问题并采取措施。同时,作者在最后提醒了使用iptables时需要注意的问题,尤其是在处理IPv6地址时需要谨慎,这一点非常重要,因为错误配置可能会导致网络服务中断。总体来说,这篇文章为读者提供了一个完整的解决方案,适用于应对异常的网络流量问题。它不仅介绍了具体的工具和命令,还强调了安全性和实际操作中的注意事项,这对管理员或网络安全从业者来说是一个很好的参考指南。
This is a comprehensive guide on how to diagnose network interfaces in Ubuntu. The author provides step-by-step instructions on how to check network interfaces, DHCP clients, routing tables, DNS resolution, and HTTP connection. The use of commands such as
ifconfig,ip,traceroute,resolvectl,nslookup, andcurlis explained in detail.One of the best features of this guide is that it offers alternative commands for each step, which is helpful for users who may not be familiar with some of the commands. The author also includes examples of output for each command, which makes it easier for readers to understand what they should see in their own output.
However, there is one area of improvement that could be made. The author does not explain the purpose of each step or why it is important to check each aspect of the network interface. Providing a brief explanation of each step would make the guide more informative and help readers understand the significance of each command.
Overall, this is a useful guide for Ubuntu users who need to diagnose their network interfaces. The author provides detailed instructions and examples, making it easy for readers to follow along.